Metrics Matter — Which Ones Are You Tracking?
At the end of the day, R1 Learning is focused on engagement, education, and improving outcomes. Since our inception, the goal for R1 is to design a path to increase and measure the impact of knowledge and skill building resources. Most behavioral health research models—such as the Theory of Planned Behavior (TPB), COM-B Model (Capability–Opportunity–Motivation–Behavior), Kirkpatrick Model, Social Cognitive Theory, and the Technology Acceptance Model (TAM)—identify knowledge attainment as a key precursor to behavioral motivation and change. R1’s journey has been to build an engagement and learning platform to capture, track, and lay the foundation for correlating knowledge attainment with behavioral health outcomes. To date, we are the only education company thinking about and linking the idea of knowledge attainment, through topical vocabulary building activities, as a path toward speed to engagement, growth, motivation, and behavioral change. The R1 Discover Vision — Imagine What We See
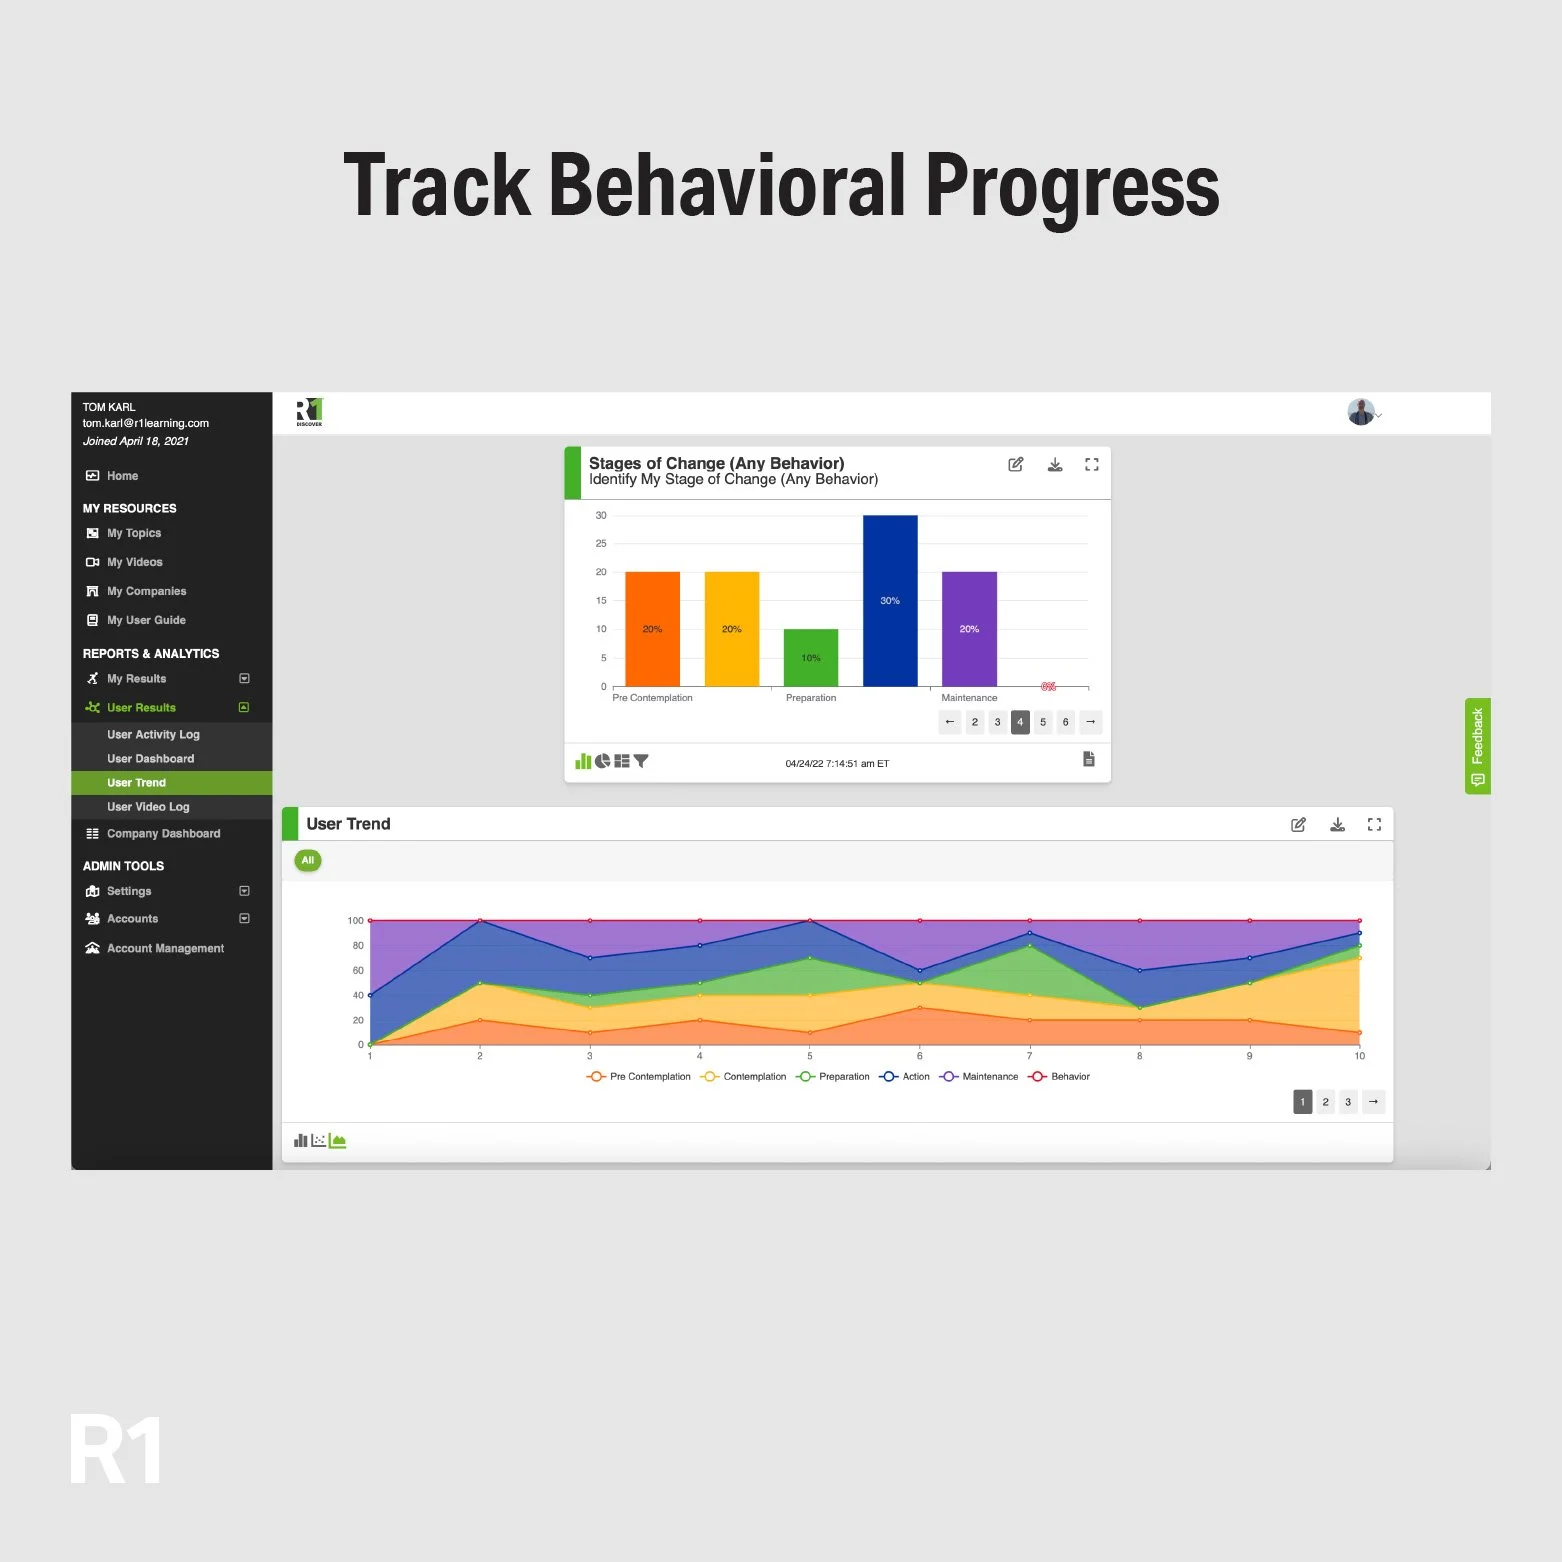
Frank Bomher, my partner and R1’s Chief Technology Officer (CTO), is driving our thinking toward tracking metrics like usefulness and relevance of learning resources. He is leading the development of the R1 Discover platform to track the speed to engagement, knowledge attainment, skill development, motivation, confidence, readiness, and ability for individuals to take action, make progress, and adopt healthier, positive behaviors.
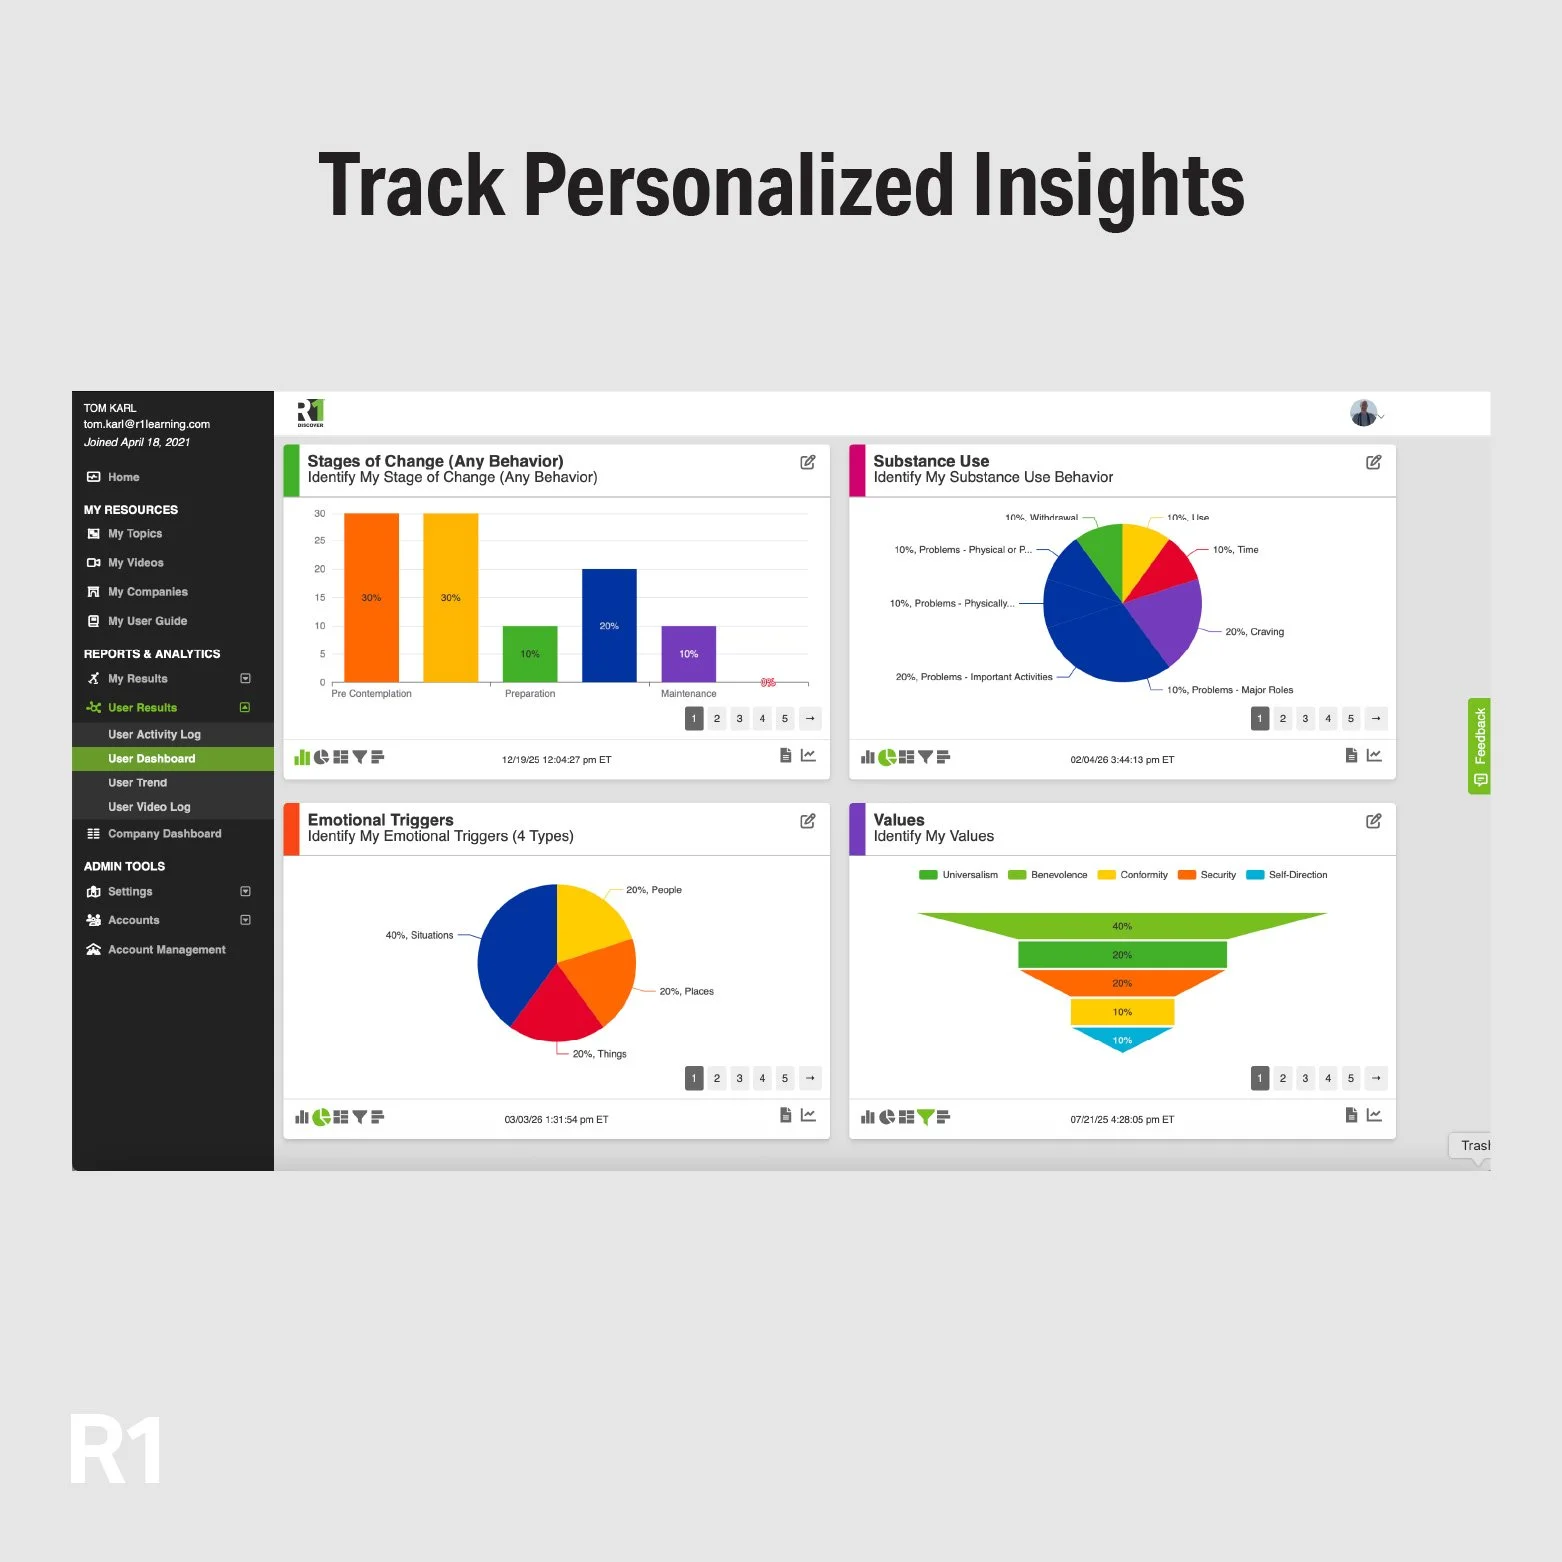
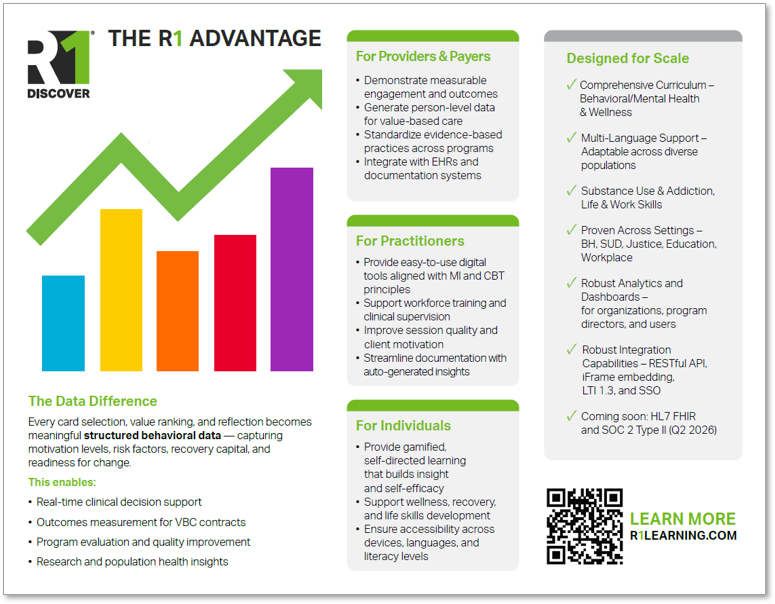
These are all important metrics to capture, track, and evaluate. Our vision includes a level of detail that we think will differentiate R1 from other learning platforms. For example: What is the impact of the specific items, behaviors, and tools that individuals pick in R1 Discover that they believe are relevant and meaningful for them given their situations and circumstances? How does this new knowledge build confidence and belief in oneself? How does this meaningful information motivate individuals towards healthier behavior? What sequences of learning activities are most effective for different populations, settings, given their high-risk behavior, substance use, or other process addictions? These are just a few of the questions we intend to explore more deeply. The foundation is in place. These metrics are coming into our research path soon, driving us up the hierarchy of evidence of promising practices.
The purpose of today’s post is to set the stage for what’s coming on the Metrics Matter front. Although it has been our vision from the start, it’s taken us over 7 years to get ready for this next exciting phase of R1’s journey. Innovation does not happen overnight. It takes time to build a proof of concept, implement in a broad range of behavioral health settings, and enhance and refine over time. Here are some of the metrics we see. Are you tracking them?

R1 Discover User Metrics
Let’s start with the basics. If you are not tracking anything, then the first requirement is to build a highly structured engagement and learning system filled with curated evidence-based and best practice content as a foundation for data capture. Here are some of the basics we are now capturing and tracking in R1 Discover. Which do you capture and track easily today?
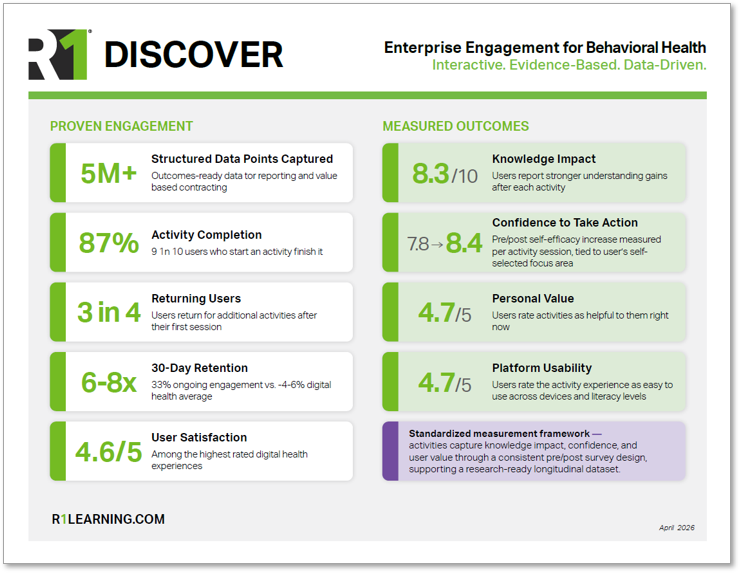
Speed To Engagement – measures how quickly users begin meaningful interaction with a platform’s content, tools, or learning activities after initial access. Faster engagement indicates the relevancy of the information presented, reflects the individual’s internal interest and motivation, and typically leads to higher retention, satisfaction, and learning outcomes.
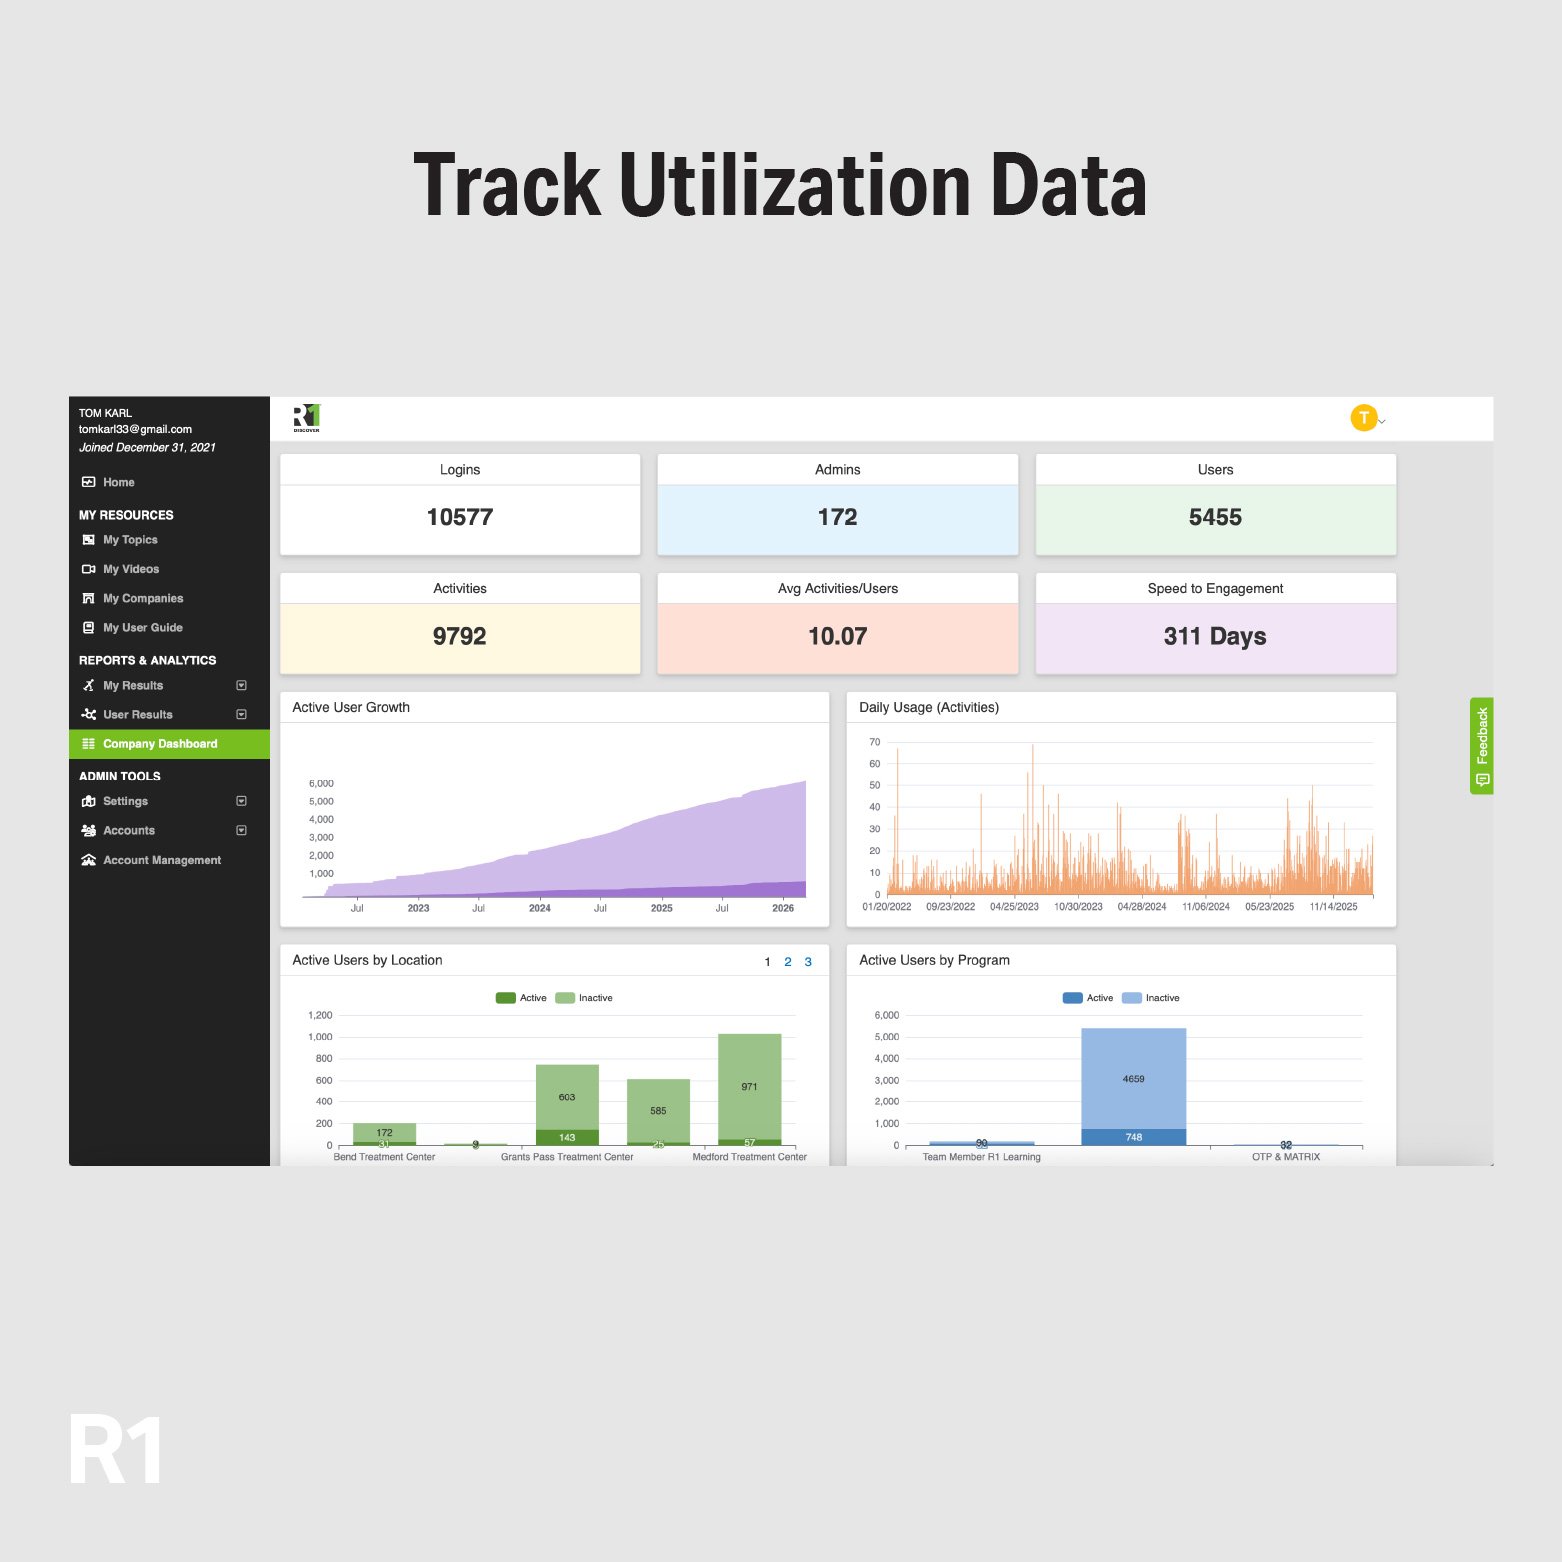
Utilization – measures how learning resources and activities are used across locations, programs, practitioners, and users. Utilization metrics reflect the extent to which available learning tools and content are accessed and applied within the system.
Activity Completions – measure the number or percentage of learning activities, assigned and self-directed, such as videos, activities, assessments, that learners fully complete within a learning platform. This metric reflects learner engagement, follow-through, and progress through the learning experiences.
Return Engagement – measures how often (frequency) learners come back to a platform to continue interacting with learning content or activities after their initial visit. Return engagement metrics reflect sustained interest and the platform’s ability to keep learners engaged over time.
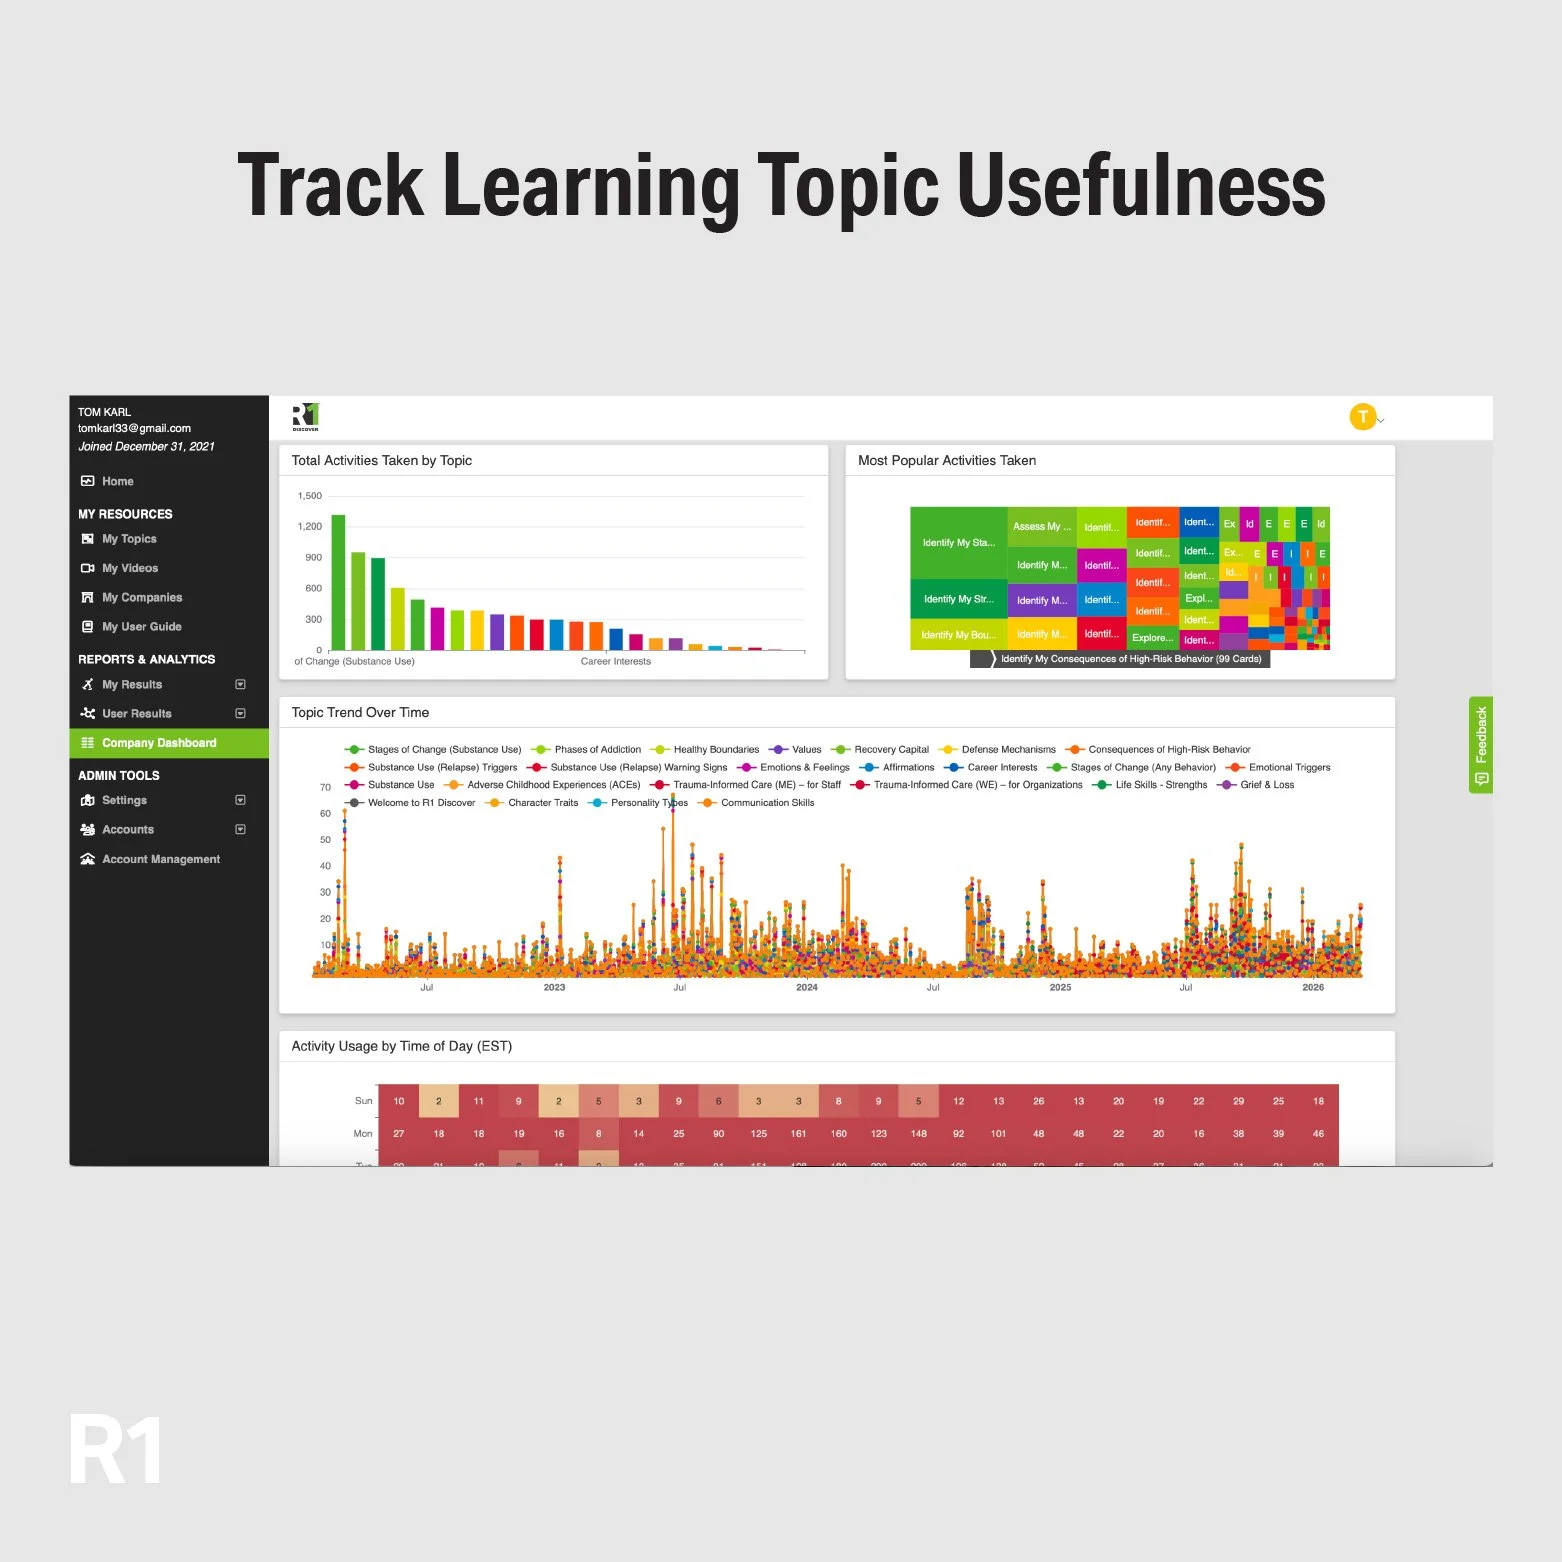
Knowledge Attainment – measures the degree to which learners acquire and demonstrate understanding of the intended concepts or skills through learning activities. This metric reflects how effectively the learning experience leads to measurable gains in knowledge or capability.
Confidence – measures a learner’s belief in their ability to apply the knowledge or skills gained from a learning activity. Confidence metrics reflect how prepared and capable individuals feel to use what they’ve learned in real life situations.
Motivation – measures a learner’s intrinsic drive to apply the knowledge or skills gained from a learning activity. It reflects the personal interest, purpose, or satisfaction that encourages learners to use what they have learned without relying on external rewards or pressure.
User Satisfaction – measures how positively learners perceive their experience using a learning platform and its activities. User satisfaction reflects how well the platform meets learner needs in terms of usability, relevance, and overall learning value.
References:
Lehmann, J., Lalmas, M., Yom-Tov, E., & Dupret, G. (2012). Models of user engagement. In Proceedings of the 20th International Conference on World Wide Web (pp. 164–168). https://doi.org/10.1145/2187836.2187902
O’Brien, H. L., & Toms, E. G. (2008). What is user engagement? A conceptual framework for defining user engagement with technology. Journal of the American Society for Information Science and Technology, 59(6), 938–955. https://doi.org/10.1002/asi.20801
Individual Metrics (Participant or Service Recipient)
Below are important metrics that align organizational, staff, and individual goals which lead to improved outcomes. Which ones are you tracking? Which ones do your engagement and educational resources impact?
Attendance – measures how often (frequency) participants are present for scheduled behavioral health services, including 1-on-1 counseling or case management sessions and group interventions. It reflects participant commitment and consistent engagement in services, learning, and support activities.
Participation – measures the extent to which individuals actively take part in behavioral health services, educational programs, and interventions. Participation metrics reflects the individual’s level of involvement and engagement in activities designed to support learning, growth, and well-being.
Retention – measures the extent to which participants continue engaging in behavioral health services, educational programs, or interventions over time. Retention metrics reflects the program’s ability to sustain ongoing participation and support individuals throughout their care or learning journey. Some measures to track here include retention rates, length of stay, and discharge reasons.
Program Completion – measures the extent to which participants finish the full course of a behavioral health service, educational program, or intervention as intended. Program completion metrics reflects participants’ ability to remain engaged through all required activities and achieve the program’s planned outcomes. These metrics may also include participants’ progression and completion of a series of levels of care based on individual needs.
Program Satisfaction – measures how positively participants perceive their experience with behavioral health services, educational programs, or interventions. Program satisfaction metrics reflects the extent to which the program meets participant needs, expectations, and perceived value. Measures to track include satisfaction surveys, referrals to program, and overall quality of life pre and post stays.
Outcomes – are indicators used to measure changes or progress in participants’ well-being, functioning, or recovery resulting from behavioral health services, education, or interventions. These measures may include assessments such as the Stages of Change, quality of life indicators (e.g., WQoL, Mental Health Quality of Life), Recovery Capital (e.g., RCS-36, REC-CAP, RCI), Social Determinants of Health (SDoH), emotional regulation, and standardized assessments like the Global Assessment of Individual Needs (GAIN), Generalized Anxiety Disorder-7 (GAD-7), Patient Health Questionnaire-9 (PHQ-9), Transdiagnostic HiTop Assessment, and more.
Other R1 Community Specific Metrics:
Behavioral Health (Substance Use/Opioid Use Programs): Medication adherence, dose satisfaction (“Is this the right dose for me?” – survey-based), craving reduction (including patient self-report: “treatment is reducing my craving”), substance-free rates, opioid free rates, Recovery Capital (e.g., RCS-36, REC-CAP, RCI), quality of life indicators.
Corrections: Recidivism, Grievances, Disciplinary Infractions, Behavioral Incidence Rates, Positive Behavioral Reports, Compliance with Institutional Rules, Emotional Regulation & Anger Management, Literacy Improvements, Educational Gains, Work Readiness (To include Vocational and Digital Literacy Skill Attainment).
Schools: Absenteeism, Disciplinary Referrals, Suspensions or Expulsions, Behavioral Incident Frequency, Academic Performance, Graduation Rates, Healthcare Utilization, Bullying.
References:
Becker, K. D., Boustani, M., Gellatly, R., & Chorpita, B. F. (2018). Forty years of engagement research in children’s mental health services: Multidimensional measurement and practice elements. Journal of Clinical Child & Adolescent Psychology, 47(1), 1–23. https://doi.org/10.1080/15374416.2017.1326121
Yardley, L., Spring, B. J., Riper, H., Morrison, L. G., Crane, D. H., Curtis, K., Merchant, G. C., Naughton, F., & Blandford, A. (2016). Understanding and promoting effective engagement with digital behavior change interventions. American Journal of Preventive Medicine, 51(5), 833–842. https://doi.org/10.1016/j.amepre.2016.06.015
Holdsworth, E., Bowen, E., Brown, S., & Howat, D. (2014). Client engagement in psychotherapeutic treatment and associations with client characteristics, therapist characteristics, and treatment factors. Clinical Psychology Review, 34(5), 428–450. https://doi.org/10.1016/j.cpr.2014.06.004
Employee Metrics (Clinical and Non-Clinical Staff)
The R1 Learning System has been developed for use as an educational on-the-job training tool for both clinical and non-clinical staff development. R1 engages, educates, and equips staff to adopt and use evidence-based practices and resources in a consistent and repeatable manner. How have you linked these strategies to the following metrics?

Employee Engagement – measures the degree to which employees are emotionally committed to their work, their team, and the organization’s goals. Higher engagement reflects stronger motivation, discretionary effort, and willingness to contribute to organizational success.
Employee Retention – measures the extent to which employees remain with an organization over a given period of time. Staff retention reflects the organization’s ability to retain its workforce creating increased workforce stability, lower recruitment & training costs, and improved performance & productivity.
Employee Training & Development – measures the extent to which employees participate in and complete training that builds the knowledge and skills needed for clinical and non-clinical roles. This metric reflects the organization’s effectiveness in preparing and developing its workforce for performance and growth.
Compliance Documentation Quality – measures the accuracy, completeness, and timeliness of documentation required to meet regulatory, clinical, and organizational standards. These quality metrics reflect how well records support compliance, accountability, and the delivery of safe and effective services.
Standardization of Clinical and Non-Clinical Care – measures the consistent use of established practices, protocols, and processes across services and providers. It ensures that individuals receive reliable, high-quality care and support regardless of location, practitioner, or program.
Evidence-Based Care Compliance – measures the extent to which services and interventions follow established evidence-based practices and clinical guidelines. This compliance metric reflects how consistently providers deliver care that is supported by research and proven treatment models.
Onboarding and Training Time – measures the amount of time it takes for new staff to complete required onboarding and training and become prepared to perform their roles. This metric reflects the efficiency of the organization’s training process and how quickly employees reach readiness and productivity.
Employee Satisfaction – measures how positively employees perceive their work experience within an organization. Employee satisfaction reflects and individual’s level of contentment and commitment with factors such as their role, work environment, support, and overall organizational culture.
References:
Noe, R. A., Clarke, A. D. M., & Klein, H. J. (2014). Learning in the twenty-first-century workplace. Annual Review of Organizational Psychology and Organizational Behavior, 1, 245–275. https://doi.org/10.1146/annurev-orgpsych-031413-091321
Schaufeli, W. B., Bakker, A. B., & Salanova, M. (2006). The measurement of work engagement with a short questionnaire: A cross-national study. Educational and Psychological Measurement, 66(4), 701–716. https://doi.org/10.1177/0013164405282471
Kahn, W. A. (1990). Psychological conditions of personal engagement and disengagement at work. Academy of Management Journal, 33(4), 692–724. https://doi.org/10.2307/256287
Organizational Metrics

Organizational Misson Advancement – measures how effectively an organization’s activities, programs, and outcomes align with and advance its stated mission. This metric reflects the organization’s ability to translate its mission into measurable actions and meaningful impact.
Revenue Generation, Growth, & Profitability – measures the financial performance of behavioral health services by tracking the revenue produced and the costs required to deliver care. These metrics reflect the program’s ability to sustain operations, maximize reimbursement, and maintain financial viability while providing services. For non-profit organizations, this can be translated into establishing and building sustainable funding streams.
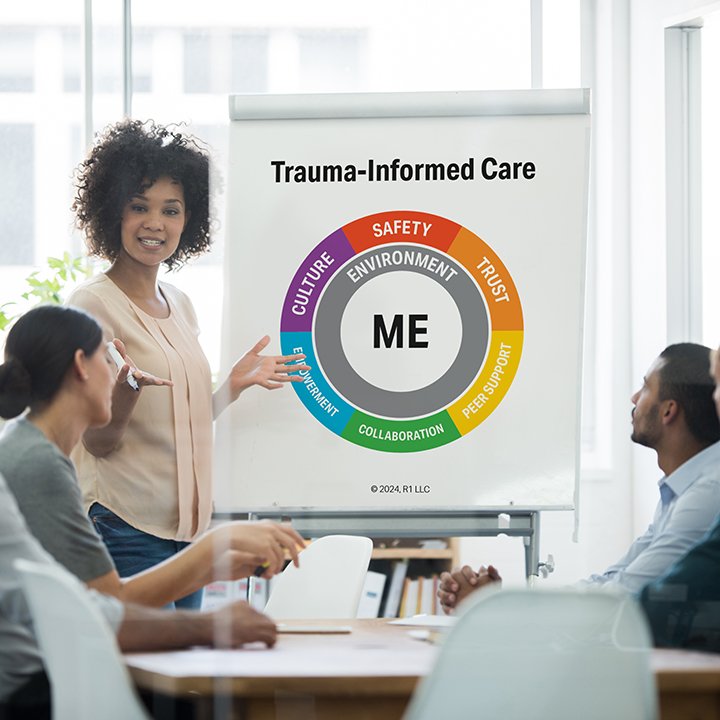
Risk Management – measures how effectively a behavioral health program identifies, monitors, and reduces clinical, operational, and safety risks. These metrics reflect the program’s ability to protect participants, staff, and the organization while maintaining safe and compliant services for areas such as trauma-informed care and privacy & security to handle, store, and share protected health information (PHI).
Regulatory Compliance – measures how well behavioral health programs adhere to applicable laws, regulations, licensing requirements, and accreditation standards. These metrics reflect the organization’s ability to maintain compliant operations, documentation, and service delivery.
Great Places to Work – measures employee perceptions of workplace culture, support, and overall job satisfaction within an organization. This metric reflects how well the organization creates a positive, engaging, and supportive environment where employees want to work and remain.
Other R1 Community Specific Metrics:
Corrections: Compliance Discrepancies (Deficiencies for Mental Health and Substance Use Programing), Safety, Recidivism, Adherence to , Grievances, Disciplinary Infractions, Behavioral Incidence Rates, Positive Behavioral Reports.
Schools: Safety, Absenteeism, Disciplinary Referrals, Suspensions or Expulsions, Behavioral Incident Frequency, Academic Performance, Graduation Rates, Healthcare Utilization, Bullying.
References:
Harter, J. K., Schmidt, F. L., & Hayes, T. L. (2002). Business-unit-level relationship between employee satisfaction, employee engagement, and business outcomes: A meta-analysis. Journal of Applied Psychology, 87(2), 268–279. https://doi.org/10.1037/0021-9010.87.2.268
Huselid, M. A. (1995). The impact of human resource management practices on turnover, productivity, and corporate financial performance. Academy of Management Journal, 38(3), 635–672. https://doi.org/10.2307/256741
Kaplan, R. S., & Norton, D. P. (1992). The balanced scorecard—Measures that drive performance. Harvard Business Review, 70(1), 71–79.
Questions to Explore
Answer the following questions for yourself or with your team:
What do you find most helpful about this post?
Which metrics are you capturing and tracking in each area? How often do you review these metrics with your leadership teams? Explain.
Which metrics do you think will have the greatest impact on your organization as you track and measure them? What is the impact you see? Explain.
Which metrics do you think will be important for your organization in the next 6-18 months? What do you need to do now to start tracking them?
What are some areas in your program where you can incorporate these ideas?
What will be the benefit for you and others as you adopt these ideas in your settings?
What is your major learning or takeaway from this post? Explain.
Download R1 Discover Metrics Handout
Thank you for reading this post and participating in this activity. Contact us if you would like to learn more about the R1 Learning System and our solutions. We look forward to hearing from you.
Copyright 2026 R1 Publishing LLC / All Rights Reserved. Use of this article for any purpose is prohibited without permission.
Here are a few ideas to help you learn more about R1 and engage others on this topic:
Share this blog post with others. (Thank you!)
Start a conversation with your team. Bring this information to your next team meeting or share it with your supervisor. Change starts in conversations. Good luck! Let us know how it goes.
Visit www.R1LEARNING.com to learn more about R1, the Discovery Cards, and how we’re creating engaging learning experiences through self-discovery.